
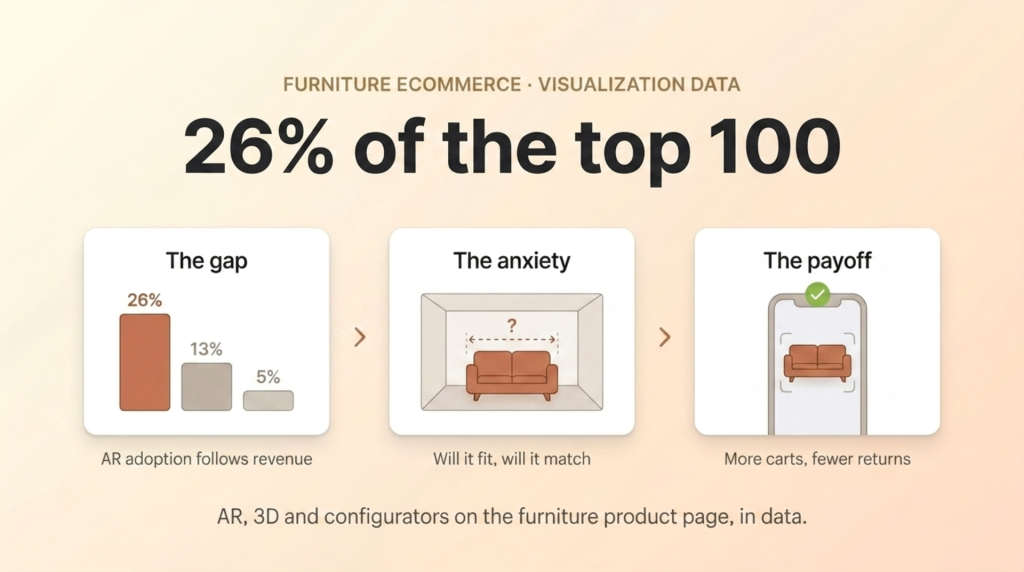
Among the 100 highest-revenue furniture and home décor stores on Shopify in the US, 26 percent run an augmented reality or 3D visualization app. Across the whole tier of stores above $1M per year, adoption drops to 5 percent, and below that line it effectively disappears. The biggest stores in the category are adopting product visualization at five times the rate of everyone else, and they are not doing it for novelty.
This post covers what that adoption gap looks like in the data, why visualization attacks furniture ecommerce’s core friction, what the verified evidence says it does, and how to approach it on a Shopify store. The numbers come from our analysis of all 42,817 active US Shopify furniture and décor stores, the dataset behind our furniture ecommerce benchmarks report.
Key Takeaways
- AR/3D adoption follows revenue: 26 percent of the top 100 US furniture Shopify stores run a visualization app, versus 13 percent of the top 500 and 5 percent of the full $1M+ tier (Soda Web Media analysis of Store Leads data, July 2026).
- The friction it attacks is measurable: 52 percent of consumers choose in-person shopping specifically to experience products before buying (Chatmeter 2025, via Shopify), which for furniture means spatial anxiety.
- Shoppers already use the technology: 58 percent of customers use AR before making a purchase, per Clutch’s 2026 report cited by Shopify.
- The furniture-specific signal is behavioral: shoppers who used a configurator bought more than they planned at nearly twice the rate of those using no 3D tools, 31 percent versus 17 percent (3D Cloud/Provoke survey).
- Returns benefit too: Gunner Kennels cut return rates by 5 percent after adding 3D models (Shopify), meaningful at furniture freight costs.
- Configurators convert customization demand into orders: Shopify cites Oakywood growing to up to 300 custom orders per month with a product configurator.
How many furniture stores actually use AR or 3D?
Very few, and almost all of them are large. In our July 2026 analysis of 42,817 active US Shopify furniture and home décor stores, 163 of the 3,446 stores above $1M per year with app data installed a detectable AR, 3D, or visualization app: 5 percent. Move up the revenue ladder and the rate climbs steadily: 13 percent of the top 500 stores, 26 percent of the top 100.
Two readings are possible, and both are probably true. Winners can afford visualization: 3D modeling a catalog costs real money, and top-100 entry starts around $24.7M in annual revenue in our dataset. But visualization also helps them win: the tools sit exactly on the friction that suppresses furniture conversion, which is why adoption concentrates among stores sophisticated enough to measure it. App detection also undercounts custom-built viewers, so treat these figures as a floor.
Survey data brackets our detection numbers from above. In a Cylindo-commissioned Forrester Consulting survey of 190 furniture decision-makers (June 2023), 17 percent had adopted AR and another 52 percent were planning or considering it. By early 2025, a London Research and Fixtuur survey of 100 furniture retailers, 64 percent of them European, found 58 percent reporting AR in use. Self-reported adoption runs ahead of what app detection can see: larger omnichannel retailers build custom, and survey samples skew toward the visualization-curious. Every measurement agrees on the direction, though: adoption concentrates at the top and keeps climbing.
Why spatial anxiety is the furniture PDP’s core problem
More than half of consumers, 52 percent, choose in-person shopping over online specifically because they want to experience and try products before buying, per a 2025 Chatmeter report cited in Shopify’s AR commerce guide. For furniture, “experience” means three questions a flat photo cannot answer: will it fit the space, how big is it really, and how will it look next to what I already own.
Those questions are the first two of the five structural frictions we mapped in our analysis of why furniture converts at 1.41 percent: spatial anxiety and tactile uncertainty. Visualization is aimed squarely at the first, answering scale, fit, and placement; tactile uncertainty, how a fabric actually feels, still belongs to swatches and honest material detail. Every unanswered question raises the perceived risk of a four-figure mistake, and shoppers price that risk in by not buying, or by defaulting to the showroom.
The behavior shift is already underway on the shopper side: 58 percent of customers use AR before making a purchase and 30 percent use it for online shopping and virtual try-ons, per Clutch’s 2026 research cited by Shopify. The demand side of visualization is not speculative anymore; the supply side, as the adoption ladder shows, is where furniture retail is behind.
The furniture-specific demand numbers are starker still. In a 3D Cloud/Provoke Insights survey of 400 US furniture buyers fielded in late 2025, 62 percent said visualizing how furniture will look in their home is a challenge, and 73 percent want higher-cost purchases shown in 3D before they buy. The behavior is not new, either: as far back as August 2019, 12 percent of US home furnishings consumers had already made a purchase using AR (Furniture Today).
What the evidence says AR and 3D actually do
The clearest public evidence is furniture-specific and behavioral. In the same 3D Cloud/Provoke survey, 31 percent of shoppers who used a configurator bought more than they had planned, against 17 percent of those who used no 3D tools, nearly twice the rate. It is correlational rather than a controlled test, since shoppers who open a configurator are already leaning in, so read it as a real directional effect rather than a guaranteed lift.
The returns effect may matter more at furniture economics. Shopify’s guide reports Gunner Kennels reduced return rates by 5 percent after adding 3D models to product pages. A 5 percent return reduction is modest for a t-shirt; on freight-shipped furniture, where a single return can consume the product’s margin, it compounds meaningfully. We break down that math in the real cost of a furniture return.
The honest summary: no free, rigorous, furniture-specific A/B evidence exists in public sources. What exists is consistent directional evidence from named cases, strong shopper-demand data, and an adoption pattern in which the category’s most sophisticated operators keep choosing to pay for visualization. That combination justifies testing it; it does not justify projecting a specific lift onto your store.
Configurators: where visualization meets customization
Product configurators (pick the fabric, the legs, the modules, and watch the piece update) solve a second furniture-specific problem: customization demand that static product pages cannot express. For made-to-order brands this is not a late-stage luxury: when a single chair comes in fifty fabrics and four leg finishes, the configurator is the catalog, since no photo shoot can cover two hundred combinations. Shopify’s guide cites Oakywood, a desk-accessories and furniture brand, growing from almost no custom orders to up to 300 custom orders per month after adding a configurator. Shopper data backs the emphasis: in the same 3D Cloud survey, configurators rated as the most helpful visualization feature (74 percent, ahead of AR itself at 54 percent).
Configured orders also skew high-ticket, which makes them natural territory for financing at the point of decision; we cover that lever in BNPL for high-ticket furniture. For brands with trade and designer programs, a configurator doubles as a quoting tool, letting a designer spec a piece without a phone call.
How to approach AR and 3D on a Shopify furniture store
Shopify supports 3D models natively: a GLB file uploaded to product media renders as an interactive model on the product page, with AR view available on mobile devices, no app required. Shopify’s mobile app can even generate the model itself, scanning a product into a GLB in 10 to 15 minutes at no cost on supported iPhones and iPads. For large furniture the real cost is still producing quality models, which is why sequencing matters more than tooling. When a piece is too large or too detailed to scan cleanly, quality models come from a freelance 3D artist, a specialist visualization studio, or the CAD files a manufacturer may already have from production, often the cheapest route to a usable model.
- Start with the SKUs where spatial anxiety is highest: large pieces, sectionals, dining tables. Model your top 20 revenue drivers first, not the whole catalog.
- Put dimensions to work alongside the model: a 3D viewer plus a clear “will it fit” dimensions module answers the fit question twice.
- Protect page speed. 3D and AR files are heavy; lazy-load and compress them so the viewer never slows the product page. On mobile-heavy furniture traffic, a sluggish page can cost more conversions than the model earns.
- Measure engaged sessions separately. Compare conversion among shoppers who interact with the model against those who do not, expecting selection bias, and against the page’s own baseline before launch.
- Treat it as a test, not a rollout. The evidence justifies an experiment on your top SKUs; your own numbers justify (or kill) the catalog-wide investment.
The pattern behind the adoption ladder is budget sequencing, not secret knowledge: the stores that reach visualization first are the ones that already fixed freight clarity, reviews, and financing, the cheaper levers, and came to 3D with those wins banked. It is the same order we follow in the furniture and home décor stores we’re building: cheap trust levers first, visualization once they are earned. Skipping to the expensive lever first is the common mistake.
Frequently asked questions
How many furniture stores use AR or 3D?
Among active US Shopify furniture and home décor stores, 26 percent of the top 100 by revenue run a detectable AR or 3D app, versus 13 percent of the top 500 and 5 percent of all stores above $1M per year, per Soda Web Media’s July 2026 analysis of 42,817 stores. Below $1M, adoption is under 1 percent.
Does AR increase furniture sales?
The clearest public evidence is furniture-specific and behavioral: in a 3D Cloud/Provoke survey, shoppers who used a configurator bought more than they had planned at nearly twice the rate of those using no 3D tools, 31 percent versus 17 percent. It is correlational, so treat it as grounds for testing rather than a promised lift.
Does 3D reduce furniture returns?
Evidence points that way. Shopify cites Gunner Kennels cutting return rates by 5 percent after adding 3D models. At furniture freight costs, where one return can erase a product’s margin, even single-digit reductions compound into real money across a year of orders.
How do I add AR to my Shopify store?
Shopify renders 3D models natively: upload a GLB file to a product’s media and the product page gets an interactive viewer with mobile AR view, no app required. The investment is model production, so start with your top 20 large-item SKUs and measure engagement and conversion before extending to the catalog.